
The definition and use of Overall Equipment Effectiveness over the years has been widely debated. Many practitioners have found that OEE has several uses and definitions which have led to considerable confusion when comparing machine-to-machine, plant-to-plant, or company-to company. Unfortunately, OEE was not designed to make comparisons from machine-to-machine, plant-to-plant, or company-to-company, but it has evolved to these common levels of misuse. OEE is not a statistically valid metric, but it has been used as such for years.
The purpose of this article is to discuss the original intent of Overall Equipment Effectiveness as a metric and a measure. I initially learned OEE from Seiichi Nakajima, the “father” of Total Productive Maintenance in 1989 and 1990, and from his related TPM publications, books, conference presentations, and seminars through the 1990s. OEE embodied in the first of the original Pillars of TPM, guided all TPM activities and measured the results of these loss-focused activities. This use of OEE evolved into the current Focused Improvement Pillar, one of eight TPM Pillars.
Overall Equipment Effectiveness Defined Overall equipment effectiveness is a measure of total (complete, inclusive, whole) equipment performance–the degree to which the asset is doing what it is supposed to do. OEE is also a three-part analysis tool for equipment performance based on actual availability, performance efficiency, and quality of product or output. OEE can be applied to manufacturing, mobile, petrochemical processes, and environmental equipment (air handlers, chillers, water treatment, etc.). OEE is used in two formats: “OEE data (information)” (the original intent) and a calculated “OEE percentage.”
- OEE data (information) are quantified loss reasons categorized by specific equipment related loss types.
- OEE percentage is a calculated relative comparison metric used for a specific equipment or process over a period of time.
Objectives of OEE Overall equipment effectiveness data (information) is used to identify a single asset (machine or equipment) and/or single stream process related losses for the purpose of improving total asset performance and reliability.
Overall equipment effectiveness data (information) is used to identify and categorize major losses or reasons for poor performance. OEE provides the basis for setting improvement priorities and beginning root cause analysis. Typical major losses are listed in Table 1, based on OEE timeline elements in Figure 1.
OEE percentage is used to track and trend the improvement, or decline, in equipment effectiveness over a period of time.
OEE percentages can point to hidden or untapped capacity in a manufacturing process and lead to balanced flow.
The use of OEE is also intended to develop and improve collaboration between asset operations, maintenance, purchasing, and equipment engineering to jointly identify and eliminate (or reduce) the major causes of poor performance since “maintenance” alone cannot improve OEE. (See 14 Major Losses – Table 1)
Cautions for Using OEE Based on the wide spread and diverse understanding and use of OEE, there are several cautions regarding its use:
- The calculated OEE (OEE percentage) is not intended for use as a corporate or plant level measure. OEE percentage is a rough measure of selected equipment effectiveness only.
- Calculated OEE is not valid for comparing or benchmarking different assets, equipment, or processes. OEE is a relative indicator of a specific single asset effectiveness compared to itself over a period of time. However, OEE can be used to compare like equipment in like situations producing like products or output.
- OEE does not measure maintenance effectiveness because most of the loss factors are outside the direct control of the maintainers.
- There appears to be no valid specification of “world-class OEE.” However, 85 percent OEE has been cited frequently. Also, “maximizing OEE” may not be justifiable. Optimum levels of OEE largely depend on the capability or capacity of the asset, the business demands, and whether it is a constraint in the process flow.
- OEE percentage calculations are not statistically valid. A calculated OEE percentage assumes that all equipment-related losses are equally important and that any improvement in OEE is a positive improvement for the business. This is generally not the case. For example, the calculated OEE percentage does not consider that a one percent improvement in quality may have a bigger impact on the business than does a one percent improvement in availability. Also, in the OEE calculation, three different units of measure are falsely considered as the same – chronological time, units per time, and counts of units produced – and are converted to percentages for comparison. OEE percentages can actually improve while actual quality losses increase significantly. OEE percentages can actually decline while output improves – efficiency and quality losses are reduced and the same planned output is generated in less time thereby lowering the “availability” percentage – three shifts of output in two shifts.
OEE Percentage Formula OEE percentages are useful when tracking and trending the performance effectiveness (reliability) of a single piece of equipment or single-stream process over a period of time. Using OEE for multiple aggregated assets is not a valid application of the formula. The following is a basic example of OEE percentage calculation.
OEE % = Availability % x Performance efficiency % x Quality rate %
Availability % = (Actual operating time ÷ Gross available time) x 100
Performance efficiency % = (Actual production rate ÷ Design production rate) x 100
Using OEE Data and Calculation to Improve Equipment Effectiveness An example OEE data (14 Major Losses) and OEE percentage calculations for one day (24 hours) of “Machine D” operation are shown below in Table 1. Note how the loss data is listed along with comments on the reasons for the loss.
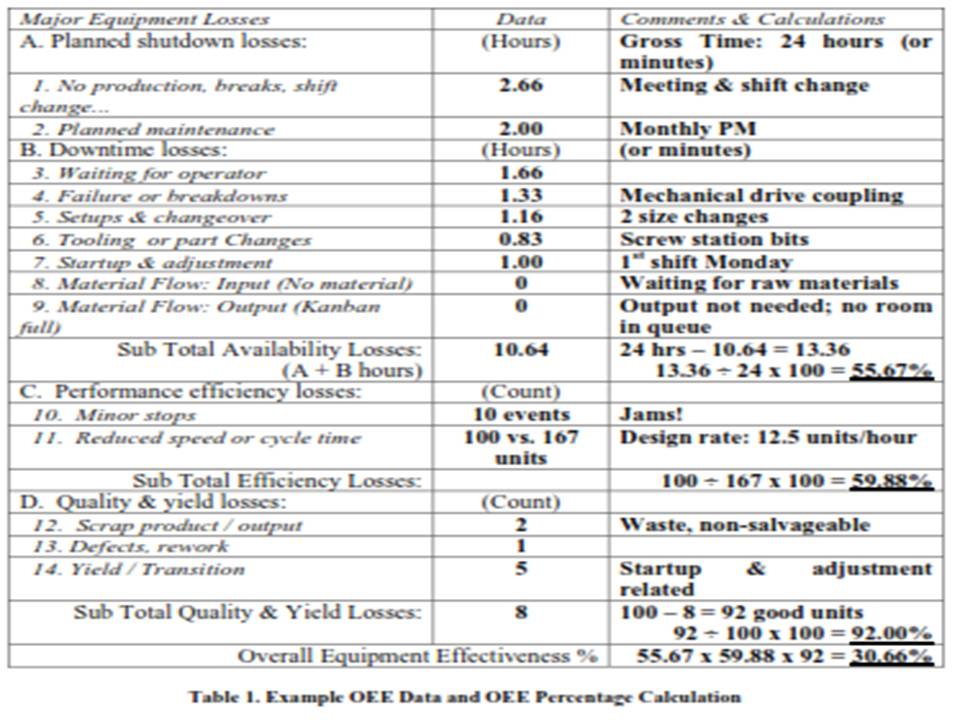
Example discussion: Historically, “Machine D” OEE percentage averaged 40.2% year-to-date, 35.06% in the prior day, but now has slipped to 30.66% in the current day as shown in the Table 1example. “Machine D’s” OEE percentage obviously shows a declining trend. These OEE percents can be charted by the month, week, day, and shift.
A review of “Machine D’s” current day OEE percentage should direct the Focused Improvement Team to further analyze the types or reasons for the performance decline. Improvements could be made in availability, efficiency, and/or quality losses. The current OEE data (information), shown in Table 1, is sufficient to begin comparisons to prior OEE data and root cause analysis activities. The question “What changed?” should guide the improvement efforts.
Overall Equipment Effectiveness Timeline
Timeline illustrations of the concept and components of Overall Equipment Effectiveness losses are shown in Figure 1. These losses are adapted from the original Major Losses and OEE teachings of Seiichi Nakajima.
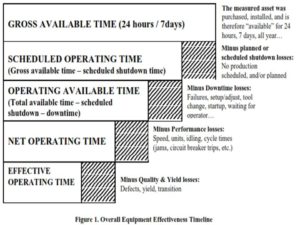
OEE Component Definitions Overall Equipment Effectiveness: A measure of equipment performance considering overall time, speed, and throughput or output. “Overall” means total, complete, all inclusive, and whole.
Gross Available Time: Calendar time 24 hour / day – 7 days /week – 365 days/year
Scheduled Operating Time: Gross Available Time – (Planned shutdown + No scheduled Prod + Planned Maintenance)
Operating Available Time: Scheduled Operating Time – Downtime losses (Failures/breakdowns, setup & adjustments, tool changes, startup losses, waiting for operator). Sometimes called “utilization.”
Performance Efficiency: The degree to which the equipment operates at “design” (or historical best) speeds, rates, and/or cycle times. Performance efficiency can vary widely depending on the material and/or products being run.
Quality: Degree to which product characteristics agree with the requirements specified for the product or output.
Equipment: A “machine” or asset that performs an operation on input materials resulting in an output (production) for example: CNC milling machine, injection molding machine, chiller, cooling tower, heat treat furnace, air compressor …
Single Stream Processes: Single process or production line asset with multiple interconnected assets functioning as a single “machine” for example: Rolling mill – steel, aluminum; metal coating/painting line; packaging line; pumping station …
Suggested Methods for Using OEE
Time Basis:
- Real time: Hourly or per operating shift
- Daily: Summary Report of OEE Performance
- Period Trending: Shift, daily, weekly monthly, quarterly, and annual comparisons
Indicator type: Typically a “lagging” metric when used as OEE percentage
Primary and Secondary Uses:
· Primary: Loss data from the OEE factors (availability, efficiency, and quality/yield) should be used to capture asset performance information as a basis for specific improvements at the plant-floor, operations, maintenance, and departmental decision-maker levels. The OEE data provides defined and quantifiable reasons for poor equipment performance. These can then be prioritized, used for root cause analysis, and problem elimination progress.
· Secondary: The OEE percentage can be used as a relative indicator of asset performance for individual equipment or single-stream processes by plant engineering, operations, and maintenance to evaluate equipment stability and the availability of untapped or “hidden” capacity for the purposes of production scheduling and capital investment justification. Tracking and tending OEE percentages for the targeted equipment or single-stream process shows rates of improvement and/or degradation over time.
OEE Issues to be Considered
- Acceptance of a single OEE definition within business and industry is unlikely given years of use and misuse.
- Lack of agreement on OEE definition between recognized OEE experts.
- Comparable or similar metrics. The metrics of Asset Utilization (AU), Overall Plant Effectiveness (OPE) for petro-chemical process industries, and Total Equipment Effectiveness Performance (TEEP) are derivations of the original Overall Equipment Effectiveness (OEE) metric promoted by Seiichi Nakajima, Vice President/President, Japan Institute for Plant Maintenance, in his seminars from 1989 through the 1995, and in his books (Introduction to TPM and TPM Development Program).
- Lack of agreement on the definition of “Availability” as 24 hours, seven (7) days, scheduled time, or actual running time (utilization).
- The “Overall” nature of OEE is not all encompassing. Other related metrics that should be considered include operating and maintenance costs, return on net assets (RONA), mean time between failures (MTBF), mean time to repair (MTTR), and utilization.
# # #
Note: Please contact the author with suggestions, ideas, and comments relative to this OEE perspective.
©2006 Robert M. Williamson
Strategic Work Systems, Inc.
Columbus, NC 28722
RobertMW2@cs.com
![]() Download a PDF of this article by clicking here OEE
Download a PDF of this article by clicking here OEE